Our Services
What We Build
For You
From WordPress websites to AI solutions — everything your brand needs to grow.
View All ServicesFrom WordPress websites to AI solutions — everything your brand needs to grow.
View All Services
Infographic design service est devenu un outil incontournable pour transformer des données complexes en visuels clairs et attrayants. Que vous soyez entrepreneur, marketeur ou créateur de contenu, savoir présenter vos informations de manière graphique améliore la compréhension et capte immédiatement l’attention de votre audience. En optant pour un service professionnel, vous bénéficiez non seulement d’un rendu esthétique, mais aussi d’une communication plus efficace qui met en valeur vos idées et vos chiffres. La capacité à synthétiser et visualiser des informations stratégiques est désormais un atout majeur pour toute stratégie digitale réussie.
L’importance pratique d’un infographic design service réside dans sa capacité à simplifier la complexité et à raconter une histoire visuelle convaincante. Un bon design d’infographie permet de rendre vos données plus accessibles, d’améliorer la mémorisation et de renforcer l’impact de votre message. En intégrant des éléments graphiques soigneusement conçus, vous engagez votre audience tout en valorisant votre marque. Que ce soit pour des présentations, des articles de blog ou des campagnes sur les réseaux sociaux, investir dans la création de visuels informatifs et attrayants optimise la portée et l’efficacité de votre communication digitale.
En résumé, un infographic design service bien exécuté transforme vos informations en outils puissants pour séduire et informer votre public. Il permet de présenter vos données avec clarté, professionnalisme et créativité, tout en renforçant votre image de marque. Dans cet article, nous vous guiderons à travers les meilleures pratiques et les avantages concrets de la création d’infographies professionnelles. Découvrez comment transformer vos chiffres et idées en visuels captivants qui retiennent l’attention et génèrent un impact durable sur vos lecteurs et clients.
Unlock the full potential of your brand with our Infographic Design Service. Click the button below to explore how Styleot can transform your data into visually stunning, easy-to-understand infographics that captivate your audience. Enhance engagement, communicate complex ideas clearly, and elevate your content with professional visual storytelling. Whether for presentations, blogs, or social media, our expert design solutions ensure your information stands out. Take the next step and discover the difference today!
| Feature | Benefit | Use Case |
|---|---|---|
| Data Visualization | Simplifies complex information for easy understanding | Reports, presentations, social media content |
| Professional Design | Enhances brand credibility and visual appeal | Corporate blogs, marketing campaigns, infographics for clients |
| Clear Storytelling | Engages audience and communicates messages effectively | Educational content, product launches, analytics insights |
| Customizable Layouts | Tailored to fit your brand style and objectives | Website posts, presentations, social media campaigns |
Data infographic creation is a powerful method to transform complex information into clear, visually appealing graphics. In today’s fast-paced digital world, audiences often skim content, making it essential to communicate data quickly and effectively. Infographics help convey insights, trends, and statistics in a format that is easy to digest and remember. By using structured layouts, vibrant visuals, and concise messaging, businesses and content creators can capture attention while educating their audience. According to HubSpot, infographics increase content engagement by over 80%, highlighting their growing importance in marketing strategies.
The main advantage of data infographic creation lies in its ability to simplify complex information while maintaining accuracy. By using charts, icons, and color-coded visuals, you can highlight key points, making data intuitive for viewers. This approach is particularly effective for:
In summary, mastering data infographic creation allows you to communicate ideas with clarity, professionalism, and creativity. Whether presenting analytics to stakeholders, publishing blog content, or sharing insights on social media, infographics turn raw data into actionable knowledge. They save your audience time, improve retention, and reinforce your brand’s authority. For more advanced tips, explore our internal Styleot Services and see how professional infographic designs can elevate your content strategy and maximize engagement across all platforms.
Harnessing data infographic creation allows you to simplify complex data into clear visuals that communicate instantly. When your audience can quickly grasp key insights, engagement skyrockets. Studies show that people remember 80% of what they see compared to 20% of what they read. By combining color-coded charts, icons, and structured layouts, your content becomes more memorable and shareable. Learn more about professional Styleot Services to elevate your brand’s visual storytelling.
For instance, a marketing report could use bar charts to show sales trends, combined with icons to represent product categories. This approach makes information easy to digest and appealing. Explore Styleot’s practical AI tools for templates and automation that simplify this process
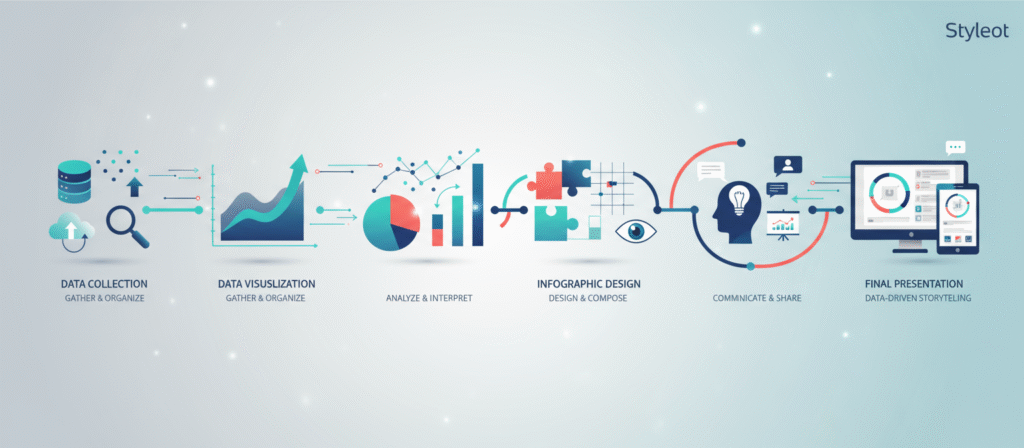
Before designing, organize your raw data logically. Visual information design works best when the structure is clear. Group related statistics, highlight trends, and remove irrelevant details. Use headings and color blocks to guide the reader’s eye. Resources like Canva’s infographic guides help streamline this process, ensuring your graphics are intuitive and professional. Internal tools, such as our niche templates, can accelerate your workflow and maintain consistency.
If reporting quarterly sales, divide data into sections like revenue, customer growth, and product performance. Highlight key points with icons or charts for clarity. Our digital product examples can help you visualize such segmentation effectively.
Design choices heavily influence the success of your infographic design service. Use harmonious colors that reflect your brand identity, readable fonts, and balanced spacing to improve comprehension. According to Smashing Magazine, proper layout can boost retention and engagement. Flat or 3D elements with smooth gradients give your visuals a modern, professional look. Check Styleot Products for resources that enhance design consistency across your content.
For example, if your brand uses blue and orange, use these consistently in charts and icons. Downloadable Canva templates can help maintain style standards while saving design time.
Interactive infographics or visually appealing static graphics increase shares and engagement. Incorporate storytelling, concise captions, and call-to-action elements. Using data infographic creation tools that integrate animations or clickable elements can elevate user experience. For guidance, check HubSpot for social media strategies. Internal references to eBooks Store can provide ready-to-use insights and inspiration.
Add subtle prompts like “Learn more” or “Download the full report” within graphics to guide users. Styleot’s contact page can also encourage clients to inquire about professional design services.
After creating your infographic, assess readability, accuracy, and engagement. Use analytics tools to track social shares, clicks, and time spent on content. Optimizing your design based on feedback ensures that visual information design continues to deliver results. Refer to Visual Capitalist for inspiration and industry benchmarks. Applying these insights strengthens future campaigns and maintains content quality.
Create two versions of an infographic with different colors or layouts and compare engagement rates. Utilize Styleot Services for professional review and optimization to ensure your graphics are both beautiful and effective.
| Step | Focus | Key Benefit | Example / Tool |
|---|---|---|---|
| 1. Master Data Infographic Creation | Simplifying complex data visually | Improved comprehension and audience engagement | Styleot Services / Practical AI Tools |
| 2. Organize and Structure Data | Logical grouping and clarity | Easier understanding and readable layouts | Niche Templates / Digital Products |
| 3. Apply Design Principles | Color, typography, and layout choices | Professional, branded, and visually appealing graphics | Styleot Products / Canva Templates |
| 4. Enhance Engagement | Interactive and shareable content | Higher shares, clicks, and audience retention | eBooks Store / Contact Page |
| 5. Review, Optimize, Measure | Analytics and performance evaluation | Improved results and informed design adjustments | Visual Capitalist / Styleot Services |
In addition to evaluating the effectiveness of your infographics, consider leveraging audience feedback to refine your design approach continuously. Engaging stakeholders in the evaluation process can provide valuable insights into preferences and comprehension levels. Furthermore, conducting A/B testing on various elements, such as imagery and messaging, can significantly enhance overall impact. By systematically implementing these strategies, you ensure that your infographic design remains relevant and compelling to your target audience.
Incorporating data-driven decisions into your design strategy is essential for maximizing the impact of your infographics. Regularly analyzing audience interactions and preferences allows for more tailored content that resonates effectively. Additionally, employing analytics tools to track performance metrics will aid in identifying trends and areas for improvement. By consistently refining your approach based on empirical evidence, you will cultivate a more engaging and successful infographic design process.